
This topic helps you get the most out of the displays that appear on the multi-function display. If the display is turned off, you can make it come back on by pressing the INFO button on the dash and touching "Trip Information" on the menu that pops up on the screen If it is on and you want it off, press the DISPLAY button on the dash and touch "Screen Off" on the screen.
The energy monitor display gives you some insight into how power is moving around in the car. The display is highly simplified and hides a lot of the interesting complexity of the Toyota hybrid system. Even so, it pays to know what the display is telling you.
For someone else's descriptions of the Energy Monitor Displays, try John1701a.
The outside temperature is displayed in the top right corner. The glowing "Energy" button reminds you which display you're looking at. Touching the "Consumption" button will switch to the Consumption display. Below, I will describe what the moving colored arrows mean. Note that the arrows are updated quite infrequently and therefore tend to be behind what the car is actually doing. Later, I will describe the different states of the battery icon. As far as I can tell, the animation of the electric motor is meaningless.

The display at right is what you're likely to see when you're stationary in Park or with your foot on the brake. No power is flowing in the hybrid system. You will get this display even if the ICE is running, for example just after you've started the car, unless the battery charge is particularly low. This no power flow display can also occurs when you "feather" the accelerator pedal while coasting down a hill or slowing down. The tiniest pressure on the pedal turns off simulated engine braking but does not call for power through MG2. The car effectively "free-wheels" as if it were in neutral. This exact pedal pressure is quite difficult to achieve.
If, when you are stationary, the battery state of charge is low, the ICE may continue to run to charge it up. The ICE causes the PSD to spin MG1 and the computer configures it as a generator and draws off power. Although the generator drag results in torque being applied via the PSD to the wheels, the car does not move because either the transmission lock is on, if you are in park, or you have the brake pedal depressed. The battery has to get quite low before the car will run the ICE just to charge the battery. Normally, the computer waits until the car is moving so the ICE can both push the car and generate electricity, which is more efficient. However, during warm-up, when the ICE is running anyway, you may see charging if the battery icon is only down to one half. Note that in this display, the "ELEC. MOTOR" icon represents MG1. The orange arrow represents mechanical power from the ICE to MG1 via the PSD. The green arrow represents electrical power flowing from MG1 to the battery.

If you launch the car when the ICE has warmed up and turned off you will see the display at right as the car gets under way using electric power only. The orange arrows represent electrical power flowing from the battery to MG2 and mechanical power flowing from MG2 to the wheels. So, in this display, the "ELEC. MOTOR" icon represents MG2. If the ICE is running while you are stopped or you press hard enough on the accelerator pedal to start the ICE quickly, you will not see this display. Allowing the car to creep by removing your foot from the brake but not pressing the accelerator also causes this display. It occurs whenever the car is being pushed only by power from the battery via MG2. This includes low speed EV mode driving and also high speed EV mode driving when the ICE is actually turning over to protect MG1 from overspinning. The ICE is turned over by MG1 and is not given fuel and sparks, so no arrow comes from the ENGINE icon. It would be more accurate to have an orange arrow pointing from the motor to the engine, but this would confuse drivers who aren't interested in the fact that in EV mode MG1 has to spin the ICE at speeds over 42 m.p.h.

The display at right will quickly become familiar as it appears whenever you call for high power from the hybrid system. This will occur during acceleration and hill climbing. Orange arrows represent mechanical power flowing from the ICE both directly to the wheels and to MG1 via the PSD. Another orange arrow shows electrical power from the battery to MG2 and a final arrow shows the mechanical power from MG2 going to the wheels. It seems that in this display, the "ELEC. MOTOR" icon represents MG1, MG2 and the PSD (power split device). This is what I meant when I said that the display "hides a lot of the interesting complexity". Exactly when you see this display depends on the battery state of charge and exactly how you are driving. You can always get it (as long as the battery icon is not empty) by stomping on the accelerator pedal. At lower power demands, the computer may not call for electric assistance. I have found that if I accelerate moderately this display appears after a few seconds of electric only but once the car gathers some speed the display switches to ICE power only and later to ICE power and battery charging.

When you have the car up to speed and you're driving steadily, not on a steep hill, and fast enough that the car does not enter EV mode, then you will almost always see one of two energy monitor displays. The first is at right and the other is the one described above as "ICE and Electric Boost". In the one at right, the same two orange arrows represent mechanical power flowing from the ICE directly to the wheels and via the PSD to the motor/generators. Electrical power generated is not sent to the other motor/generator to push the car but is instead used to charge the battery.
Now, you may be wondering why all of a sudden I don't seem to know which motor/generator is which. The usual explanation of the Toyota Hybrid System would have MG1 generating the electrical power in this situation. Since I have been trying to put together a mathematical model of the THS, I have had cause to look closely at how my car operates. What I discovered is that when I cruise at moderate speed, MG1 spins backwards and not forwards. Therefore, it cannot generate power and must in fact be configured as a motor and use up power generated by MG2. Because this mode of operation was rather hard for people on the Prius_Technical_Stuff discussion group to accept, it has come to be known as heretical mode. I try to describe it in the topic "What's Going On As I Drive?" under the heading "Cruising at Moderate Speed".
The picture at right shows a third "cruising" display. Some of the electrical power generated by one of the motor/generators is used by the other motor/generator to help drive the wheels and the rest goes to charging the battery. In my experience, this display is not very common and when it does occur it does not last very long.

Occasionally (in my experience), the display at right appears showing no power flowing either to or from the battery and all power from the ICE being used to move the car. Orange arrows represent mechanical power flowing from the ICE both directly to the wheels and to the motor/generators via the PSD. One motor/generator (MG1?) converts mechanical energy into electrical energy which is used by the other motor/generator (MG2?) to help drive the wheels. Mechanical power from the motor/generator to the wheels is represented by the third orange arrow. It seems to me that this display shows up during moderate acceleration after electric boost ends and before a stable "cruising" display appears.
 Regeneration
When you take your foot off the accelerator pedal while the car is moving at more than a crawl, the display at right appears to represent the charging of the battery using energy taken from the car's motion. The green arrows represent mechanical energy from the wheels to MG2 and electrical energy from MG2 to the battery. The amount of power being transferred is not indicated by the display and will be quite small during coasting but much larger if you apply the brakes. There is also no indication that the ICE turns at speeds of 42 m.p.h. and above to protect MG1 from spinning to fast. To do this, MG1 generates electrical power as well as MG2. Again, the "ELEC. MOTOR" icon "hides" this detail, which the driver does not need to know.
 Reversing
At right is a display you won't see very often. You must have the car in reverse and the ICE must continue to run to charge the batteries. There are no arrows from the ICE to the wheels because having no reverse gear, the Prius cannot move backward using the ICE. Usually, the car backs up using electric power only and turns off the ICE. But, if the battery charge is particularly low, the ICE may stay on. The downward orange arrow represents mechanical energy delivered by the ICE to the power split device. MG1 generates electrical power, some of which is used to charge the battery, represented by the green arrow. The rest is sent to MG2, which drives the car backwards, represented by the orange arrow to the wheels.
 The Battery Icon
At the bottom right of the Energy Monitor Display is the battery icon. This shows you want Toyota want you to know about the battery state of charge. The diagram at right shows the five possible states of this icon, according to information collected in the Yahoo! group toyota-prius. I have only ever seen my icon in the 3/4 and 1/2 states, and this quite common. You may only see the FULL icon after descending a long hill. You may only see 1/4 after climbing a long hill and EMPTY on a really serious hill such as Mount Washington.
However, the icon does not show the actual battery charge level. The range of the icon only spans the range of actual charge that Toyota decided to use, which is less than the full battery capacity. To use more would detract from battery life, so we don't argue. According to Bill Powell of the Yahoo! groups, whom I have no reason to doubt, the range of actual battery charge used is 56% to 96%. So, one quarter as we see it would be 56-66%, half would be 66-76%, three-quarters 76-86% and full 86-96%. Or something like that. Each bar represents 10% of the total charge capacity of 6.5 ampere.hours at 273.6 volts. In units I can relate to, that's 640kJ per bar.
For comparison, a regeneration star (50Wh) is 180kJ. With one passenger, the kinetic energy of the car at 65 m.p.h. is about 640kJ, so if regenerative braking were perfect (which is isn't - far from it) then stopping from this speed would produce exactly one bar of charge. How much gasoline would the ICE consume to produce 640kJ? A bit less than 2 fluid ounces (57ml).
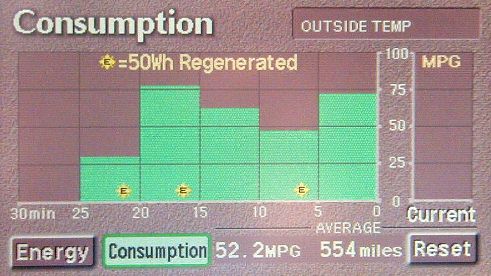
The consumption display provides information on fuel use per distance travelled. As well as showing off the car's economy, this lets you see how different driving styles and road conditions effect fuel efficiency. You can change the way you drive or the way you plan trips to use even less fuel and benefit the environment further.
As for the Energy Monitor Display, the outside temperature is displayed in the top right corner. The glowing "Consumption" button reminds you which display you're looking at. Touching the "Energy" button will switch to the Energy Monitor Display display. Below, I will describe what the various other display elements mean. Note that the display is updated quite infrequently and therefore tends to be behind what the car is actually doing.
Exactly what is shown on the display differs between the US, the UK and the more enlightened countries using SI measurements. Both the US and UK cars show miles-per-gallon, but bear in mind that the UK's "imperial" gallon (4.54609 litres) is larger than the US gallon (3.78541 litres). Other countries display litres of fuel per 100km travelled. Note that these two ways of measuring fuel use are upside-down with respect to each other. High m.p.g. is good, but high litres per 100km is bad. The US/UK display shows high fuel consumption during acceleration and hill climbing as a low m.p.g. figure, but shoots off the top when going down hill or running in EV mode. In other countries, you can easily see the engine run at low power or cut off entirely, but here the bar shoots off the screen when you call for a lot of power. I don't know why Toyota didn't make it possible to chose which style of display to use.
At the right, a bar shows current fuel consumption. This is computed over a very short period of time, just a couple of seconds, but not continuously. There is a small lag between a change in engine conditions and the response of the display. Watching this (out of the corner of your eye!) tells you how what you're doing at the present time affects fuel consumption. After the novelty wears off, it is only really useful for driving under steady conditions and knowing when the ICE has (probably) stopped.
Average fuel consumption is shown at the bottom of the display. This average is computed over the driving you've done since you last touched the Reset button. Since you can decide when to reset the average, you can choose how to use this part of the display. I describe some common strategies below.
Prius owners on the Yahoo! discussion group toyota-prius seem to agree that the average MPG figure shown by the consumption display is optimistic by about 2 MPG. Personally, I figure the error as 4%, but since I get around 50 MPG it amounts to the same thing. So, when my display reads 52.2 MPG, I consider that to be more like 50 MPG and that's what I report to anyone who asks.
Most of the display is given over to a histogram of historical fuel consumption in five minute intervals. For each five minutes that the car is turned on, whether in motion or not, the display shifts one column to the left and a new bar appears for the most recent five minutes. The left-most column disappears and is lost. This display can be quite interesting to study when you are stopped, or for your passengers to study while you are driving. It is often possible to identify features of your trip, such as periods of cruising and stop-and-go traffic and to see how they affect fuel consumption. The first column after a cold start will show the fuel used to warm up the engine and catalytic converter.
The historical fuel consumption of the display is cleared when you turn the car off, which is disappointing if you are making a trip with stops in the middle.
Discussion on the Yahoo! group toyota-prius reached the conclusion that the car monitors distance travelled and fuel used and does some simple arithmetic to obtain the displayed values. This is the correct way to obtain a fuel economy average. Distance travelled comes from the same source as the odometer and trip meters, that is sensors on the wheels. Fuel use is probably measured by the fuel injection system.
In the five-minute fuel consumption columns, you may see small yellow stars or diamonds. These represent energy recovered through regenerative braking and simulated engine braking during that period. Each diamond represents 50 watt hours, or 180 kJ in units that make sense to me. You may also see half stars, which represent 90 kJ of recovered energy. The kinetic energy of the car with driver and one passenger at 65 m.p.h. is about 640 kJ. Slowing from this speed to a standstill within a five minute period would cause three and one half regeneration stars to appear if energy recovery were perfect. Because only a fraction of the energy is recovered, you will see far fewer stars.
The appearance of stars cannot be easily classified as good or bad. Certainly, energy has been recovered that in a conventional car would be wasted as heat, so that is good. However, because regeneration has quite a low efficiency, for every star you see, several stars of energy have, indeed, been wasted as heat and that is bad. So, don't drive to make stars appear! If you can avoid braking you will get better fuel economy and get no stars. However, since braking is sometimes inevitable, the stars remind us that we don't lose as much energy as a car without regenerative brakes.
Touching the reset button starts a new calculation of average fuel consumption. The values that were previously displayed are lost forever unless you wrote them down. Both the MPG and miles begin again at zero. As you continue to drive, the distance covered and fuel consumed since you pressed the button are recorded. The distance is displayed directly and the distance divided by the fuel used is displayed as the average fuel consumption. You will notice that the fuel consumption changes rapidly at first. This is because with only a small distance covered since reset the new distance you travel has a large proportional effect on the total and hence on the average. A short run in EV mode after a reset will easily send the MPG reading to the ceiling of 99.9 MPG! As distance builds, the fuel consumption number will get "stiffer", that is, change more slowly in response to instantaneous consumption.
There are three popular policies for resetting the average fuel consumption calculation. Of course, you can do this at any time and these are just offered as suggestions.
Lifetime Fuel Consumption - if you never touch reset, the display will show the average fuel consumption since you took delivery of the car. People who use this policy are adamant that this is the most important thing to know. To my mind, however, there are problems associated with it. First, you have to somehow prevent passengers from touching reset. If you plan to have the car for ten years, that's a lot of diligence. A moment's lapse of attention and you might as well have used a different policy. Second, you lose the opportunity to watch how different driving styles, journeys, weather etc. affect economy. You can monitor how much fuel you put into the car to get this information, but it's not as immediate as watching the display. Third, you can't use the most reliable (in my opinion) method of knowing when it is time to refuel. If you want lifetime fuel consumption, my suggestion is to record all the fuel you put in the car, add it up and divide my the number of miles on the odometer. That way, your figure is not disturbed by the inaccuracy of the car's fuel flow measurement.
Tank-by-Tank Fuel Consumption - if you touch reset every time you fill up with fuel, the display will show the average fuel consumption for each tank of fuel.
Trip Fuel Consumption - if you touch reset when you begin a trip, the display will show the average fuel consumption for that trip. This can be a very interesting thing to know and to brag about when you arrive at your destination. You can learn over time how the car responds to certain types of journey and road conditions. By keeping track of fuel on paper or with a computer, you lose nothing from the long term record. However, you can't use the consumption display to decide when to refuel if you reset the average for each trip.
The outside temperature is measured by a sensor in front of the radiator and displayed at the upper right of both the Energy Monitor and Consumption displays. It disappears when you turn the car to ACC. (Research exact sensor location)